
CAT Score vs Percentile 2024- Know Percentile Vs Marks
CAT Score vs Percentile 2024- The marks obtained and percentile for CAT is completely different. The official won’t release the CAT percentile vs score. Based on last year’s CAT score vs percentile details we have provided an analysis. The CAT score vs percentile matrix may vary every year. The factors that impact the CAT percentile vs scores are number of students appeared, difficulty level of the exam and more.
CAT 2024 Score Vs Percentile
The CAT score reflects a candidate’s performance in each exam section. This score is calculated by adding the marks obtained from correct answers and subtracting the penalties for incorrect ones. Specifically, candidates earn +3 points for each correct answer, lose -1 point for each incorrect answer, and receive 0 points for unattempted questions..
| CAT Percentile | VARC score | DILR score | QA score | Overall score |
|---|---|---|---|---|
| 99.9 %ile | 48 | 36 | 40 | 102 |
| 99.5 %ile | 44 | 32 | 30 | 89 |
| 99 %ile | 40 | 28 | 27 | 80 |
| 98 %ile | 36 | 25 | 23 | 71 |
| 95 %ile | 30 | 19 | 18 | 57 |
| 90 %ile | 25 | 16 | 15 | 49 |
| 85 %ile | 21 | 13 | 12 | 40 |
| 80 %ile | 19 | 11 | 10 | 36 |
| 75 %ile | 17 | 10 | 9 | 31 |
| 70 %ile | 15 | 9 | 8 | 29 |
Other Related Links
| CAT Preparation Tips | CAT Admit Card | CAT Application form |
| CAT Exam Date | CAT Exam Pattern | CAT Eligibility |
| CAT Syllabus | CAT Result | How to Prepare CAT while working |
CAT Score Vs Percentile 2024- What is the CAT Scaled Score?
The CAT scaled score is the normalized score obtained from the raw score. This normalization process ensures fairness by accounting for variations in difficulty levels across different test slots. Adjustments are made to a student’s raw score, which can vary by section and test slot. For instance, in CAT 2023, the third slot was relatively easier, resulting in a reduction of approximately 4 marks after normalization. Conversely, for the first slot, an addition of around 3 marks was made.
CAT Marks Vs Percentile 2023: Percentile Vs Marks Distribution
| Percentile | Scaled Score |
| 100 | 142.9 |
| 99.99 | 118.67 |
| 99.95 | 106.95 |
| 99.9 | 101.43 |
| 99.83 | 95.96 |
| 99.5 | 84.29 |
| 99.37 | 81.75 |
| 99 | 76.02 |
| 98.5 | 71.15 |
| 98.37 | 70.31 |
| 98 | 66.68 |
| 97.7 | 65.91 |
| 97 | 61.56 |
| 96.6 | 59.99 |
| 96 | 58.1 |
| 95.42 | 56.13 |
| 95 | 54.86 |
| 94 | 53.32 |
| 93 | 52.35 |
| 92.05 | 47.99 |
| 91 | 46.13 |
| 90 | 45.16 |
| 85 | 42.29 |
| 80 | 41.19 |
| 75 | 40.02 |
CAT Scores vs Percentile- VARC Section
| Percentile | Scaled Score |
| 100 | 61.66 |
| 99.99 | 57.32 |
| 99.87 | 51.02 |
| 99.5 | 44 |
| 99.26 | 41.76 |
| 99 | 39.7 |
| 98.21 | 35.88 |
| 96.72 | 31.47 |
| 95 | 28.68 |
| 93.5 | 26.33 |
| 90 | 23.39 |
| 86.43 | 20.66 |
| 80 | 17.58 |
| 75 | 15.27 |
| 62.28 | 11.53 |
CAT Scaled Scores vs Percentile- DILR Section
| Percentile | Scaled Score |
| 100 | 50.6 |
| 99.99 | 42.7 |
| 99.9 | 36.58 |
| 99.71 | 32.78 |
| 99.43 | 29.71 |
| 99.14 | 27.56 |
| 99 | 27.39 |
| 98.37 | 24.58 |
| 96.83 | 20.88 |
| 95.53 | 19.6 |
| 90 | 15.63 |
| 84.87 | 13.01 |
| 80 | 11.67 |
| 77.88 | 10.81 |
| 72.94 | 9.67 |
CAT Scaled Scores vs Percentile- QA Section
| Percentile | Scaled Score |
| 100 | 49.46 |
| 99.98 | 41.87 |
| 99.9 | 37.83 |
| 99.5 | 31.39 |
| 99 | 28.18 |
| 98.5 | 25.73 |
| 98 | 24.31 |
| 97.5 | 23.71 |
| 97 | 22.7 |
| 96.5 | 21.69 |
| 96 | 21.41 |
| 95.5 | 20.44 |
| 95 | 19.68 |
| 94 | 17.91 |
| 93.5 | 17.66 |
| 93 | 17.54 |
| 92.5 | 15 |
| 90 | 13.63 |
| 80 | 9.2 |
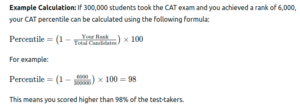
What is CAT Percentile and How is it Calculated?
A percentile is a statistical measure used to compare an individual’s performance against the rest of the candidates in the merit list. For instance, scoring in the 90th percentile on the CAT means that 90% of the test-takers scored below you. Therefore, candidates with a percentile of 90 or above are in the top 10% of all test-takers.
Before evaluating CAT score versus percentile for 2023, it’s essential to understand the mathematical concept behind CAT percentiles. These percentiles indicate the proportion of candidates who scored lower than you. The CAT marks versus percentile analysis helps gauge your performance relative to other candidates.
Here’s how to calculate CAT percentiles:
Other Important Links
| Essays | Careers | Results |
| Admit Card | Admission | Latest Education News |
Stay Connected With StudyGrades for Latest Updates on Board Results 2025!